
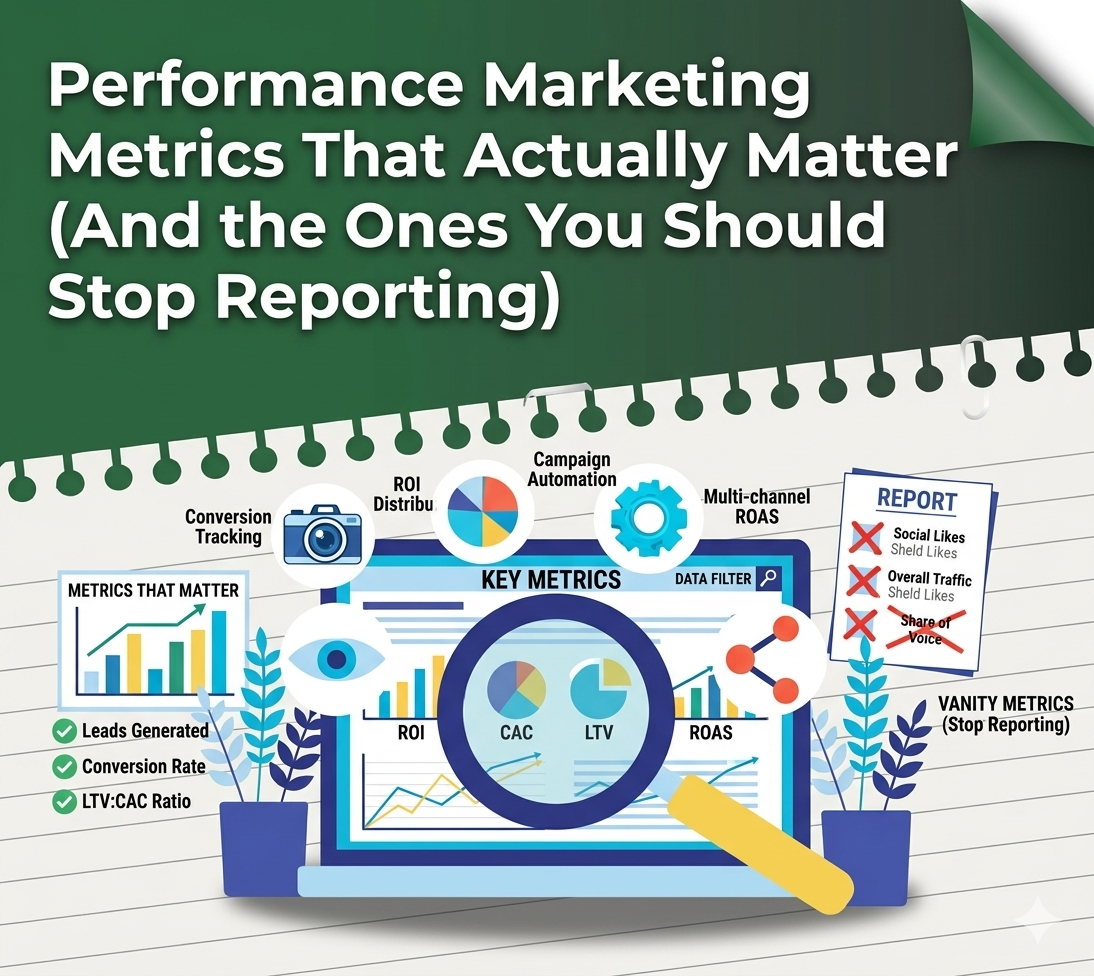
Most performance marketing reports are too long, cover the wrong things, and do not help clients make a single better decision.
This is not an accusation. It is a structural problem. Reporting dashboards default to capturing everything the platform records. Clients ask for more data because more data feels like more accountability. Account teams add metrics to answer the questions clients did not ask last month. The result is a report that is comprehensive in the worst sense of the word: it contains everything and communicates almost nothing.
The performance marketing metrics that actually matter are a much shorter list than most agencies report. And the metrics that commonly appear on those reports, the ones that generate questions in client meetings but do not actually help anyone make a better decision, are worth understanding precisely so you can stop reporting them.
The Problem with Vanity Metrics in Performance Reporting
Vanity metrics vs performance metrics is a distinction that most marketers know but few reporting frameworks actually enforce. A vanity metric is any number that looks good in a report but does not correspond to a business outcome and cannot be acted upon. A performance metric is a number that connects to a business result and changes what someone decides to do.
The reason vanity metrics persist in performance reporting is not ignorance. It is comfort. Impressions, reach, and click volume are easy to explain, easy to increase, and easy to present as progress. They create the appearance of activity. But a client who has spent six months watching their impression count grow while their pipeline stays flat is a client who is about to leave.
The standard for every metric in a performance marketing report should be the same: does this number help the client decide something? If the answer is no, it does not belong in the report.
What Is ROAS in Marketing (And When It Misleads You)
Return on ad spend is calculated as revenue attributed to advertising divided by advertising spend. A ROAS of 4 means that for every pound or dollar spent on advertising, four came back in attributed revenue. At its most useful, it is the primary efficiency indicator for direct response campaigns where revenue can be directly attributed to specific ad activity.
The problem is the word attributed. ROAS is only as reliable as the attribution model that produces it. Last-click ROAS overvalues the final touchpoint before conversion and undervalues every touchpoint that generated awareness or consideration earlier in the journey. A campaign with a high last-click ROAS may be claiming credit for conversions that would have happened anyway through brand or organic channels.
ROAS is a useful directional metric. It is a misleading absolute one. Report it in context, alongside the attribution model it is based on, and with enough historical data to identify trends rather than point-in-time readings.
61% of marketing leaders report that their most significant measurement challenge is cross-channel attribution, with last-click models still the most common despite being the least accurate. Source: Gartner Marketing Analytics Survey, 2024
Marketing Attribution Models: Why Your Numbers Depend on How You Count
Marketing attribution models determine how credit for a conversion is distributed across the touchpoints that preceded it. The model you use directly determines the ROAS, CPA, and channel efficiency numbers you report. This is not a technical detail. It is the foundational assumption that everything else is built on.
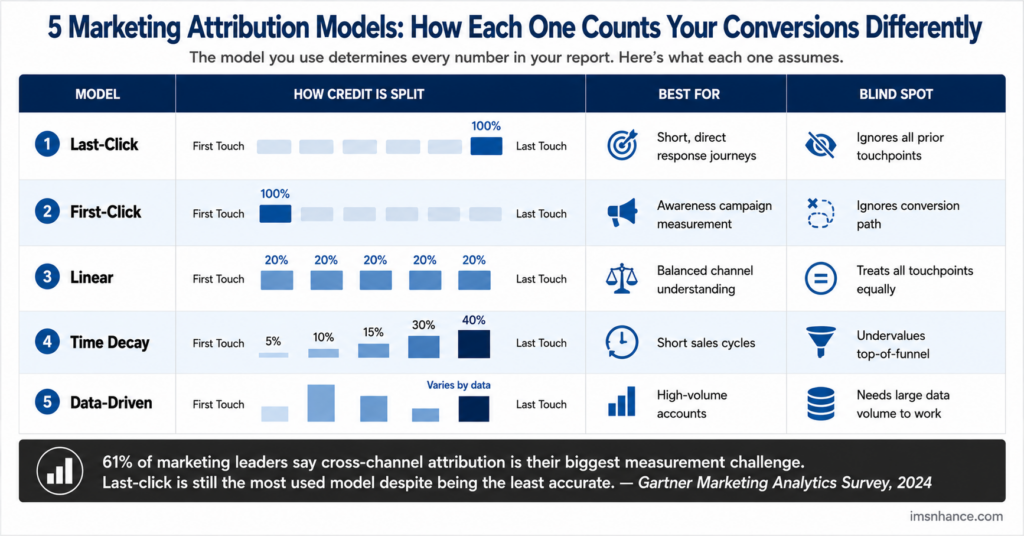
The most important thing about attribution models is consistency. Changing the model mid-campaign changes every number in the report. Choose a model that reflects how your clients’ customers actually buy, document it, and apply it consistently so that trends are comparable over time.
Performance Marketing KPIs That Drive Decisions
These are the performance marketing KPIs that should be in every client report because they connect directly to business outcomes and can be acted upon.
Cost Per Acquisition (CPA)
CPA in performance marketing is the total spend divided by the number of conversions generated. It is the foundational efficiency metric for any campaign where the objective is generating leads, sales, or sign-ups. Everything else in the report exists to explain why CPA is what it is and how it is trending.
Return on Ad Spend (ROAS)
For e-commerce and direct revenue campaigns, ROAS is the primary performance indicator. Report it alongside the attribution model and against a target ROAS agreed with the client, not as a standalone number.
Conversion Rate
Conversion rate tells you what proportion of the audience that clicked converted into the desired action. A low conversion rate with a high click volume signals a post-click problem: landing page, offer, or audience quality. It is the metric that most directly connects campaign performance to client-side improvements.
Cost Per Click (CPC) Trend
CPC as a point-in-time number means very little. CPC as a trend over time tells you whether the auction environment is becoming more competitive and whether your Quality Score improvements are holding down costs. Report it in context.
Quality Score and Ad Relevance (Paid Search)
Quality Score is Google’s measure of ad relevance, expected CTR, and landing page experience. It directly affects both ad position and cost per click. A declining Quality Score is an early warning signal that the campaign needs attention before CPA deteriorates.
Performance Marketing Metrics You Should Stop Reporting
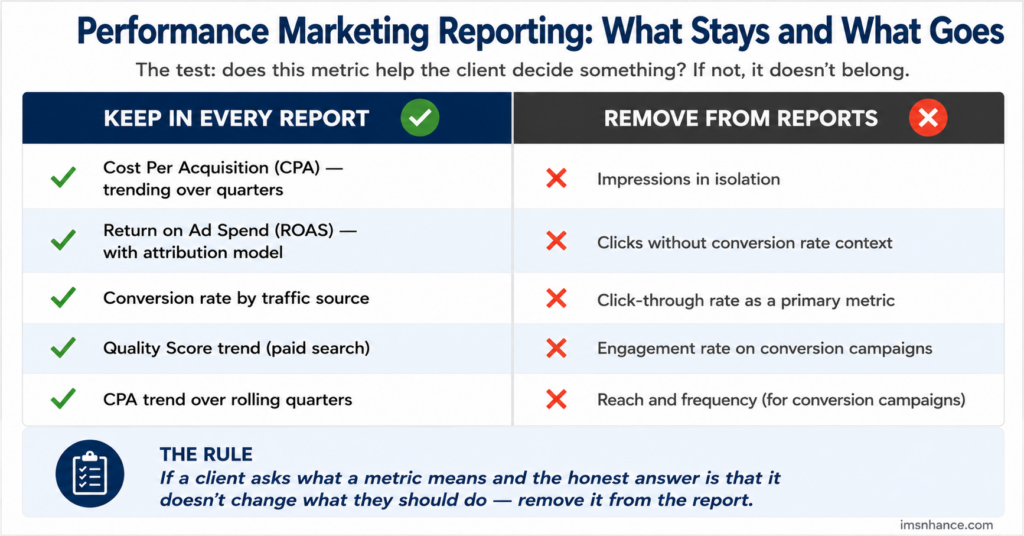
These appear in most performance marketing reports. They should not.
- Impressions (in isolation). Impressions without context say nothing about whether the right audience saw the ad or whether seeing it had any effect. Report reach and frequency for awareness campaigns; do not report raw impressions for conversion campaigns.
- Clicks without conversion context. A high click volume with a low conversion rate is underperformance, not progress. Never report clicks without conversion rate alongside them.
- Click-through rate as a primary metric. CTR tells you whether the ad creative is compelling to the people who see it. It tells you nothing about whether those people were the right audience or whether they converted. It is a diagnostic metric, not a performance metric.
- Engagement rate on paid social (for conversion campaigns). For brand campaigns, engagement is a valid signal. For conversion campaigns, the only engagement that matters is the one that leads to the desired action. Everything else is noise.
- Vanity metrics vs performance metrics in client-facing reports. If a client asks what a metric means and the honest answer is that it does not change what they should do, remove it from the report.
How to Measure Performance Marketing Beyond the Platform
Platform-reported numbers have a structural bias: they attribute as much credit to themselves as the attribution model allows. Google Ads reports on Google Ads performance. Meta reports on Meta performance. Neither is motivated to show you the overlap, the wasted spend, or the conversions that would have happened without the paid channel.
How to measure performance marketing accurately requires data sources that sit outside the platforms:
- CRM conversion data. Match campaign leads against CRM pipeline and close rates. This tells you which campaigns produced revenue, not just which ones produced leads.
- Incrementality testing. Run holdout tests where a portion of the audience is unexposed to the campaign and compare conversion rates. The difference is the true incremental effect of the campaign.
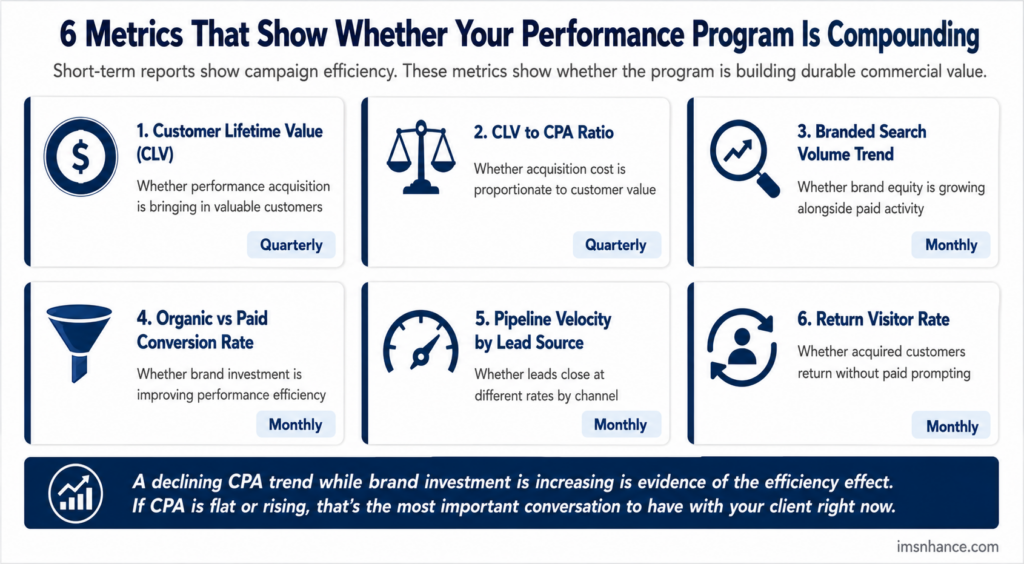
- Branded search volume trends. Rising branded search is a performance outcome of both brand and performance campaigns and is measurable outside any platform.
- Revenue per channel (not just attributed revenue). Look at actual revenue by acquisition channel over time, not just what the platforms claim to have driven.
Digital Marketing Metrics to Track for Long-Term Growth
Short-term performance reporting captures campaign efficiency. The digital marketing metrics that tell you whether the program is building durable commercial value are different.
Building a Reporting Framework Clients Actually Trust
The goal of performance reporting is not to demonstrate activity. It is to give clients the information they need to make good decisions about their marketing investment. A reporting framework that achieves this has three characteristics.
It leads with the business question, not the platform metric. Structure every report around the client’s commercial objectives first. Is CPA tracking to target? Is the program generating pipeline? Is ROAS improving? Answer these questions first, then provide the supporting metrics.
It distinguishes between metrics that change strategy and metrics that change execution. ROAS trending downward might change the channel strategy. A poor Quality Score changes the ad copy and landing page. These are different conversations requiring different responses, and the report should make the distinction clear.
It is consistent over time. The value of a performance metric is in its trend, not its point-in-time value. A reporting framework that changes metrics every quarter prevents clients from understanding whether their program is improving. Agree the core KPI set with each client at the start of the engagement and hold it.
How IMS nHance Approaches Performance Reporting
IMS nHance produces white label performance reporting for agency partners that is built around client commercial objectives rather than platform data exports. Every report is structured to answer the questions the client actually needs answered, produced under your agency branding, and formatted to integrate with how your account team presents to clients.
We work with agency partners who are moving away from vanity-metric-heavy reporting and want to provide clients with reporting that builds trust and informs better decisions. The starting point is agreeing what your clients are actually trying to achieve and building the reporting framework backward from there.
Conclusion
Performance marketing reporting is not a data problem. It is a prioritisation problem. The metrics that matter are a short list. The metrics that appear on most reports are a much longer one. The difference between the two is not technical sophistication. It is the discipline to remove what is not helping and to build reporting around what clients actually need to decide.
Stop reporting everything the platform gives you. Start reporting what changes decisions. That is the difference between a report that generates questions and a report that generates trust.
If your agency is ready to move to performance reporting that clients actually use, talk to subject matter experts at IMS nHance to know more.